How to Read Forex Charts-A Quick Guide
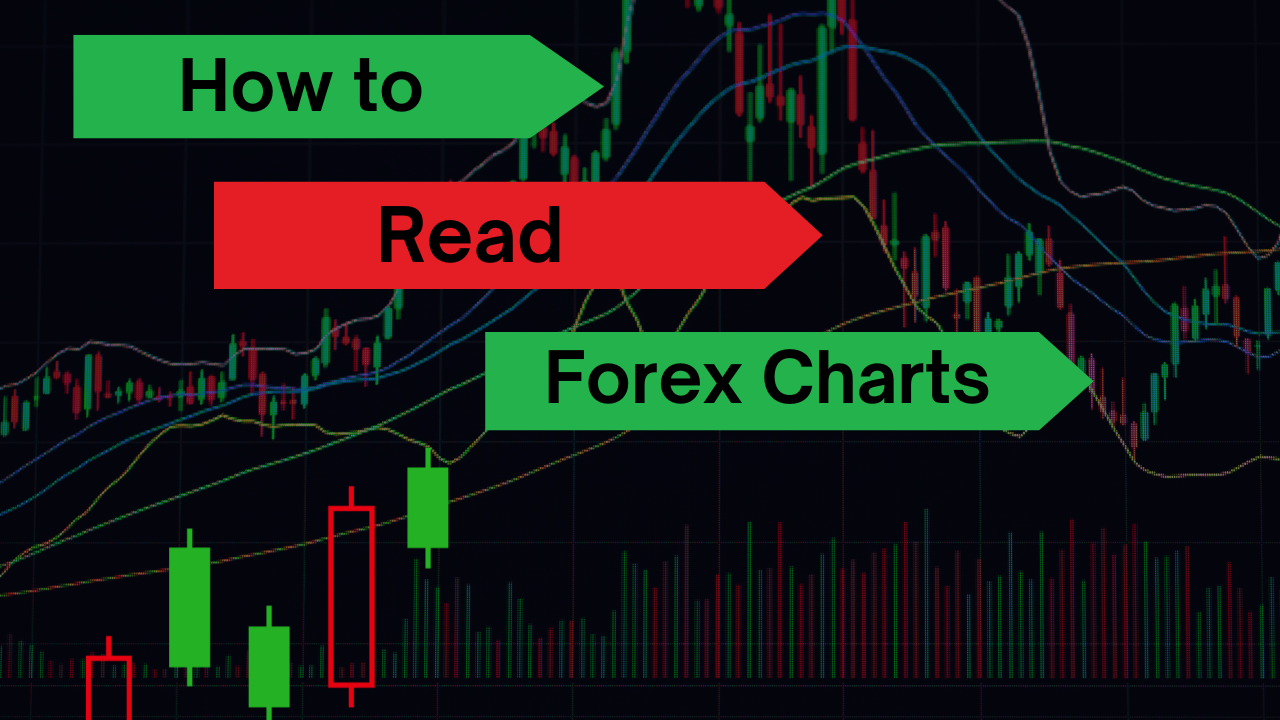
Understanding how to read forex charts is crucial for anyone who wants to succeed in forex trading. Charts provide a visual representation of currency price movements, allowing traders to make informed decisions. For beginners, reading forex charts might seem overwhelming. But with the right approach, it becomes easier over time.
In this article, we will break down the key elements of forex charts and guide you step-by-step on. How to use them effectively in your trading journey. Whether you’re looking to understand forex chart basics or learn about advanced candlestick patterns, this comprehensive guide will help you build a solid foundation for successful forex trading.
What is a Forex Chart?
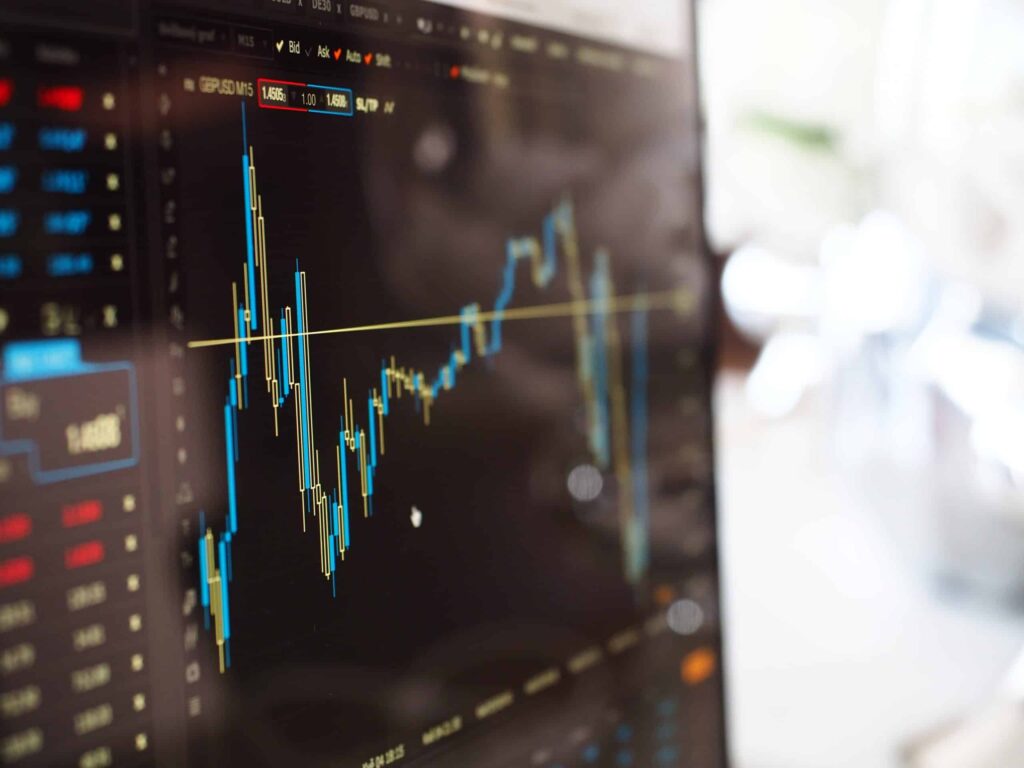
A forex chart is a graphical representation of currency pairs showing the historical price movements over a specific period. It is one of the most important tools for traders as it helps them visualize market trends and price actions. Which are essential for making informed trading decisions.
There are several types of forex charts used by traders to analyze the market, but the most common ones are line charts, bar charts, and candlestick charts. Each type offers different insights, and understanding these charts is the first step in becoming a successful trader.
The forex chart is usually divided into two main components: time and price. The horizontal axis (X-axis) represents time, while the vertical axis (Y-axis) represents the price of the currency pair. The chart’s data points show how the price of the currency pair has changed over the selected time frame.
Forex charts allow traders to spot various patterns and trends, such as uptrends and downtrends. By analyzing price movements on these charts, traders can predict future price changes and make informed decisions on whether to buy or sell a particular currency.
Understanding the fundamentals of forex charts is essential for analyzing market behavior and gaining insights into potential price movements. By learning how to interpret the data presented on a chart, you will be able to make smarter decisions in your forex trading strategy.
Understanding the Basics of Forex Charts
To become proficient in forex trading, understanding the basics of forex charts is essential. These charts offer a clear visual representation of price movements, making it easier for traders to spot trends, reversals, and key price levels. Here’s a breakdown of the key components you need to know when analyzing forex charts:
- Price: The vertical axis on the chart represents the price level of the currency pair. Each point on the vertical axis indicates a specific price, and the distance between the points shows how much the price has moved. Understanding price movements is critical in determining whether a trade will be profitable or not.
- Time: The horizontal axis represents time. Depending on the selected time frame, the chart shows price movements over different periods (minutes, hours, days, weeks, or months). Shorter timeframes are often used for day trading, while longer timeframes are preferred for swing traders and investors.
- Trend: Trends are one of the most important concepts in chart analysis. If the price is consistently moving higher, it is said to be in an uptrend, and if it is moving lower, it’s in a downtrend. Understanding trends helps traders know when to enter or exit a position.
- Support and Resistance: These are horizontal levels on a chart where the price tends to reverse or stall. Support is where the price tends to find a floor, while resistance acts as a ceiling. Identifying these levels is essential for determining potential entry and exit points in forex trading.
Types of Forex Charts
There are three main types of forex charts that traders use to analyze the market: line charts, bar charts, and candlestick charts. Each type has its own strengths and weaknesses, and the best one to use depends on your trading style and objectives. Let’s dive deeper into each type:
Line Charts
A line chart is the simplest type of forex chart. It connects the closing prices of a currency pair over a specific period, creating a continuous line. The line shows the overall trend of the currency pair but lacks detail about the open, high, and low prices for each time period.
Advantages of Line Charts:
- Easy to read and understand
- Good for identifying overall trends
- Helpful for beginners looking for a high-level view of price action
Disadvantages of Line Charts:
- Doesn’t show the full range of price movements (open, high, low, close)
- Lacks detail for more advanced analysis
Bar Charts
A bar chart provides more detailed information than a line chart. Each bar represents the price movement for a specific time period and shows four key price points: the open, high, low, and close (OHLC). The vertical line of the bar indicates the range of the price, and the horizontal ticks show the open and close levels.
Advantages of Bar Charts:
- Shows more detailed information than a line chart (OHLC)
- Helps traders understand price ranges and market volatility
- Useful for identifying trends and reversals
Disadvantages of Bar Charts:
- Can be more complex and harder to interpret for beginners
- Doesn’t show as much detail as candlestick charts
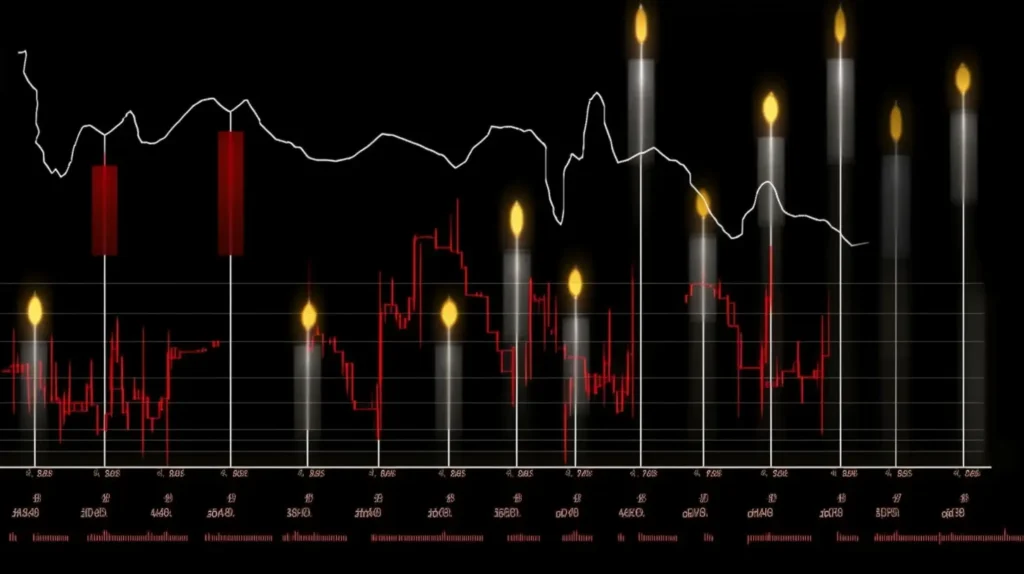
Candlestick Charts
The candlestick chart is one of the most popular and widely used chart types in forex trading. Each candlestick represents a specific time period (e.g., 1-minute, 1-hour, or 1-day) and consists of a body and wicks. The body represents the open and close price, while the wicks (or shadows) show the high and low price.
Advantages of Candlestick Charts:
- Easy to read and interpret with clear visual patterns
- Provides detailed information about price movements
- Candlestick patterns like Doji, Engulfing, and Hammer help predict market behavior
- Ideal for both short-term and long-term traders
Disadvantages of Candlestick Charts:
- Requires knowledge of candlestick patterns to fully understand market psychology
- Can be overwhelming for beginners at first
How to Read Forex Candlestick Charts
Forex candlestick charts are one of the most powerful tools for traders in the forex market. They not only display price movements but also provide insights into market sentiment. Understanding how to read forex candlestick charts is crucial for making informed trading decisions.
Each candlestick has four key components:
- Open: The price at which the market opened for the given time period.
- Close: The price at which the market closed for the given time period.
- High: The highest price reached during the given time period.
- Low: The lowest price reached during the given time period.
A candlestick consists of a body and wicks (shadows). The body represents the range between the open and close prices, while the wicks show the high and low prices for that time period.
- Bullish Candlestick: If the close price is higher than the open price, the candlestick is considered bullish (typically shown in green or white), indicating buying pressure.
- Bearish Candlestick: If the close price is lower than the open price, the candlestick is considered bearish (typically shown in red or black), indicating selling pressure.
Common Candlestick Patterns
Candlestick patterns are essential for understanding market psychology. Some of the most popular patterns include:
- Doji: A candlestick where the open and close prices are nearly the same, indicating market indecision.
- Engulfing: A pattern where a small candlestick is followed by a larger candlestick that completely engulfs the previous one, indicating a potential reversal.
- Hammer: A candlestick with a small body and a long lower wick, often indicating a reversal from a downtrend to an uptrend.
These patterns help traders predict potential market reversals or continuations, giving them an edge in the forex market.
Understanding Price Action on Forex Charts
Price action refers to the movement of the market price over time. Analyzing price action on forex charts helps traders understand market behavior, determine trends, and predict future price movements. Understanding price action is an essential skill for traders, as it allows them to make decisions without relying solely on indicators.
Key Price Action Concepts
- Trends: A trend is the overall direction in which the price is moving. A bullish trend is when prices are moving upwards, while a bearish trend is when prices are moving downwards. Identifying trends early is crucial for entering and exiting trades at the right time.
- Support and Resistance: These are key levels where the price tends to reverse or stall. Support is where the price tends to bounce up, while resistance is where the price tends to reverse downward. Recognizing these levels allows traders to enter trades near support and exit near resistance, maximizing profit potential.
- Breakouts: A breakout occurs when the price moves through a key support or resistance level, signaling a potential trend change or continuation. Traders often look for breakouts to make entry points for trades.
Price Action Strategies
- Swing Trading: Traders use price action to identify market swings—movements from one support level to the next resistance level (or vice versa). By entering at the beginning of a swing, traders can capitalize on the price movement.
- Trend Following: When a trend is identified, traders often follow the price action to enter positions in the direction of the trend, maximizing the potential for profits as the price continues in the same direction.
- Reversal Patterns: Traders also use price action to identify reversal patterns, such as head and shoulders or double tops/bottoms, to predict when the market may reverse its current trend.
Understanding price action gives traders a clear view of the market’s behavior, enabling them to make better decisions based on price movements rather than relying on lagging indicators.

Time Frames and How They Impact Forex Chart Analysis
Time frames are a crucial element in forex chart analysis because they determine the amount of data displayed and how a trader interprets price movements. Forex charts can be viewed in different time frames. Ranging from minutes to months. Choosing the right time frame depends on your trading strategy, whether you’re a day trader, swing trader, or long-term investor.
Types of Time Frames
- Short-Term Time Frames:
- 1-minute (M1), 5-minute (M5), 15-minute (M15): These time frames are best suited for day traders who want to make quick trades based on short-term price movements. They allow traders to capture small price movements within a single day.
- 30-minute (M30), 1-hour (H1): Slightly longer time frames, still ideal for day trading and scalping. Providing more data points without being too overwhelming.
- Medium-Term Time Frames:
- 4-hour (H4): A popular time frame for swing traders who hold positions for several days. This time frame helps to capture medium-term trends without getting caught in short-term market noise.
- Long-Term Time Frames:
- Daily (D1), Weekly (W1), Monthly (MN): These time frames are ideal for long-term traders or investors who are less concerned with short-term fluctuations and more focused on overall trends. Weekly and monthly charts are used for analyzing the big picture, making them suitable for position trading.
Impact of Time Frames on Analysis
- Trend Identification: Different time frames help identify trends of varying lengths. A long-term trend seen on a daily or weekly chart may not be visible on a 5-minute chart, which focuses on micro-trends.
- Signal Accuracy: Shorter time frames often provide more frequent trading signals. But they may also result in false signals due to market noise. Longer time frames give a clearer picture of the market, reducing the chances of false signals.
- Entry and Exit Points: Traders use a combination of time frames to find the optimal entry and exit points. For example, day traders might use a 5-minute chart for entry and a 1-hour chart to confirm the broader trend. While swing traders could use a 4-hour chart to spot trades and a daily chart for confirmation.
Choosing the right time frame is key to effective forex chart analysis. Using multiple time frame analysis (MTFA) helps ensure that trades align with the larger trend while still providing precise entry points.
How to Use Indicators and Tools on Forex Charts
Indicators and tools are essential in forex chart analysis, as they help traders confirm trends, predict future price movements, and refine their trading strategies. These technical analysis tools can be used in conjunction with price action to improve accuracy and increase the chances of successful trades.
Popular Forex Indicators
- Moving Averages (MA):
Moving averages smooth out price data to help identify trends. They calculate the average price over a set period. The two most common types are:- Simple Moving Average (SMA): The average of prices over a specified period.Exponential Moving Average (EMA): Gives more weight to recent prices and reacts faster to price changes.
- Relative Strength Index (RSI):
The RSI is a momentum indicator that measures the speed and change of price movements. It ranges from 0 to 100, indicating whether a currency pair is overbought (above 70) or oversold (below 30). Traders use the RSI to spot potential reversals. - Bollinger Bands:
Bollinger Bands consist of a moving average and two standard deviation lines. They expand and contract based on market volatility. When price touches the upper band. It may indicate an overbought market. While touching the lower band suggests the market may be oversold. - MACD (Moving Average Convergence Divergence):
The MACD is a trend-following momentum indicator that shows the relationship between two moving averages of a currency pair’s price. It’s used to identify potential buy or sell signals, as well as the strength of the trend.
Tools for Forex Chart Analysis
- Trend Lines: A trend line is drawn by connecting two or more price points on a chart, helping to identify support and resistance levels. It is crucial in recognizing trends and making decisions based on price action.
- Fibonacci Retracement: Fibonacci levels are used to identify potential support and resistance levels after a price movement. These levels are based on the Fibonacci sequence and are crucial for predicting price reversals and corrections.
- Volume Indicators: Volume indicators, such as the On-Balance Volume (OBV), show the amount of trading activity. High trading volume confirms trends. While low volume suggests a lack of momentum.
Common Forex Chart Patterns
Forex chart patterns are formations on a forex chart that occur when the price moves in a certain way. Recognizing these patterns can help traders predict future price movements and make informed trading decisions. Understanding common forex chart patterns is essential for successful technical analysis.
Popular Forex Chart Patterns
- Head and Shoulders (H&S):
The head and shoulders pattern signals a reversal in the market trend. It consists of three peaks:- The left shoulder (a rise followed by a fall),
- The head (a higher peak),
- The right shoulder (another peak that is lower than the head).
A head and shoulders pattern forms after an uptrend and signals a potential reversal to a downtrend. The opposite of this pattern is the inverse head and shoulders, which indicates a potential trend reversal from down to up.
- Double Top and Double Bottom:
The double top is a bearish reversal pattern that occurs after an uptrend. It forms when the price peaks twice at nearly the same level, signaling resistance. The double bottom is the opposite pattern, indicating a bullish reversal from a downtrend, where the price hits a low twice before reversing direction. - Triangles:
Triangular patterns often indicate that the market is consolidating before making a decisive move. The two main types are:- Symmetrical Triangle: This pattern forms when the price narrows within converging trendlines, signaling indecision in the market. A breakout from the triangle indicates the direction of the next move.
- Ascending and Descending Triangles: These patterns are usually continuation patterns, indicating that the market is likely to continue in the direction of the previous trend once the breakout occurs.
- Flags and Pennants:
Flags and pennants are continuation patterns that occur after a strong price movement. A flag is a small rectangular shape that slopes against the prevailing trend, while a pennant is a small symmetrical triangle. Both patterns signal a brief consolidation before the price continues in the direction of the previous trend.
How to Use Forex Chart Patterns in Trading
To use these patterns effectively, traders often wait for the pattern to complete before making a trade. This confirmation helps avoid false signals. For instance, in a head and shoulders pattern, traders might wait for the price to break below the neckline before entering a short position. Similarly, in a double bottom, a breakout above the peak between the two bottoms confirms the buy signal.
Tips for Interpreting Forex Charts Effectively
To interpret forex charts effectively, traders need to develop a systematic approach to reading price movements. Here are some practical tips to improve your ability to analyze and interpret forex charts:
Focus on Trend Identification
The first step in chart analysis is identifying the trend. The market can move in three ways: uptrend, downtrend, or sideways trend. Use trendlines or moving averages to help identify the direction of the market. Once the trend is identified, you can make more accurate predictions about potential entry and exit points. Remember, trend is your friend, so aligning your trades with the prevailing trend increases your chances of success.
Use Multiple Time Frames
Multiple time frame analysis (MTFA) allows traders to confirm trends across different time periods. For instance, if you are trading on a 1-hour chart, you can look at the 4-hour or daily chart to check if the overall trend supports your position. This approach helps filter out false signals and improves the accuracy of your trades.
Look for Support and Resistance Levels
Support and resistance are key concepts in chart analysis. Support levels are prices where the market tends to find buying interest, while resistance levels are prices where selling interest is strong. By identifying these levels, you can anticipate potential price reversals or breakouts. Pay attention to price action near these levels, as it can provide valuable insights into future price movements.
Combine Price Action with Indicators
While price action provides valuable information, combining it with indicators can improve the reliability of your analysis. Indicators like the RSI, MACD, and Moving Averages can confirm signals provided by price action. For example, a bullish engulfing pattern combined with a RSI above 30 can be a strong buy signal, indicating that the market is turning bullish.
Practice Patience and Wait for Confirmation
One of the most important tips for interpreting forex charts effectively is practicing patience. Don’t rush to take a position based on incomplete or inconclusive patterns. Always wait for confirmation before acting. For example, if you spot a double top pattern, wait for the price to break the neckline before entering a short position. This reduces the risk of entering a false breakout.
Keep a Trading Journal
Maintaining a trading journal is an excellent way to track your progress and learn from your mistakes. Record the details of every trade, including the charts you used, your reasoning for entering the trade, and the outcome. This practice will help you identify patterns in your decision-making and refine your chart interpretation skills.
Conclusion
In conclusion, reading forex charts is a fundamental skill for any forex trader. By understanding how to analyze various chart types, price action, and indicators, traders can make informed decisions that enhance their chances of success in the forex market. Whether you’re a beginner or an experienced trader, mastering the basics of chart analysis is crucial for interpreting price movements and identifying trade opportunities. With consistent practice, a strong understanding of common forex chart patterns, and a disciplined approach, you can improve your trading strategy and make more accurate market predictions.
Remember, successful forex trading is not just about analyzing charts but also about having the patience to wait for the right opportunities and managing your risk effectively. By applying the tips and techniques discussed in this article, you can develop your skills and build confidence in reading forex charts.
Read more Top Forex Trading Mistakes to Avoid
Frequently Asked Questions
What is the best type of forex chart for beginners?
The line chart is the simplest and easiest for beginners to understand. It shows the closing price over a specific period and provides a clear, straightforward representation of price movement. Once you’re more comfortable, you can start using bar charts or candlestick charts, which provide more detailed information about price action.
How do I use support and resistance levels in forex trading?
Support is a level where the price tends to find buying interest, and resistance is a level where selling interest is strong. Traders use these levels to anticipate potential price reversals or breakouts. If the price reaches support, it may bounce back up; if it reaches resistance, it may reverse down. Identifying these levels helps traders make better entry and exit decisions.
Can I use forex chart patterns to predict market movements?
Yes, forex chart patterns like head and shoulders, double top, and triangles can help predict future price movements. These patterns indicate a change in market sentiment and can signal potential reversals or continuation of trends. However, it’s important to wait for confirmation before acting on these patterns to avoid false signals.
What indicators should I use with forex charts?
Common indicators include the Relative Strength Index (RSI), Moving Average Convergence Divergence (MACD), and Moving Averages. These indicators help confirm signals from price action and chart patterns. For instance, an RSI value over 70 might indicate an overbought condition, while a value under 30 could signal an oversold condition.