Best Technical Indicators for Forex Trading

Forex trading can be both exciting and challenging. Traders often rely on a blend of tools and strategies to predict market trends and make profitable decisions. Among these tools, technical indicators play a pivotal role. They offer traders insights into market dynamics, helping them identify potential price movements, trends, and opportunities. In this article, we’ll explore the best technical indicators for Forex trading, how they work, and why they are indispensable for traders.
Introduction to Best Technical Indicators for Forex Trading
When trading in the Forex market, traders often ask, “What tools can help me make informed decisions?” The answer lies in technical indicators. These tools analyze historical price data, offering insights into market trends, potential reversals, and price momentum. Whether you’re a beginner or a seasoned trader, knowing the best technical indicators for Forex trading can significantly enhance your trading strategies.
Technical indicators are widely used because they:
- Provide clarity in a volatile market.
- Help identify entry and exit points.
- Minimize emotional trading by relying on data-driven analysis.
The right combination of indicators can act as a trader’s compass, guiding them through the complexities of Forex trading with confidence.
What Are Technical Indicators?
Technical indicators are tools that use mathematical calculations to analyze historical price and volume data. These calculations produce visual representations, such as lines, oscillators, or bands, that help traders interpret market behavior.
Why Are Technical Indicators Important?
- They highlight key market trends and patterns.
- Help in determining overbought and oversold conditions.
- Assist in identifying support and resistance levels, which are crucial for predicting price reversals.
Types of Technical Indicators
There are four main categories of technical indicators:
- Trend-following indicators: These show the overall direction of the market. Example: Moving Averages (MA).
- Momentum indicators: They measure the speed of price changes. Example: Relative Strength Index (RSI).
- Volatility indicators: These indicate the intensity of price movements. Example: Bollinger Bands.
- Volume indicators: They analyze trading volume to understand market strength. Example: On-Balance Volume (OBV).
How Do Technical Indicators Work?
- Trend Indicators like Moving Averages smooth price data over time, helping traders identify whether the market is bullish or bearish.
- Momentum Indicators like RSI highlight whether the market is overbought (likely to reverse downward) or oversold (likely to reverse upward).
- Volatility Indicators measure market fluctuations, allowing traders to adjust their strategies during high or low volatility periods.
By combining multiple indicators, traders can cross-verify signals and minimize risks.
Why Technical Indicators Are Crucial in Forex Trading
The Forex market is dynamic and volatile, with price movements influenced by various factors such as global economic conditions, geopolitical events, and market sentiment. In this fast-paced environment, traders rely on technical indicators to simplify decision-making and minimize risks. Here’s why these tools are indispensable:
Identify Market Trends
Technical indicators help traders determine the overall market direction—whether it’s bullish, bearish, or consolidating. This allows them to align their strategies with the prevailing trend, enhancing the probability of success. For instance:
- Moving Averages (MA) smooth out price fluctuations to highlight long-term trends.
- MACD (Moving Average Convergence Divergence) provides insight into momentum shifts.
Predict Price Movements
By analyzing historical price data, indicators like RSI and Fibonacci Retracement identify potential entry and exit points. These tools can forecast areas where prices might reverse or accelerate, giving traders an edge in timing their trades.
Enhance Risk Management
Volatility indicators like Bollinger Bands allow traders to gauge market uncertainty and adjust their positions accordingly. Knowing when the market is highly volatile helps traders set stop-loss levels and manage their risk exposure effectively.
Eliminate Emotional Trading
Relying on data-driven insights reduces the influence of emotions in trading decisions. Indicators provide objective information, preventing impulsive actions that can lead to losses.
In essence, technical indicators serve as a trader’s roadmap, offering clarity and precision in a complex trading environment.
Top Technical Indicators for Forex Trading
Choosing the best technical indicators for Forex trading depends on your trading style, goals, and market conditions. Here are the top indicators every trader should know:
Moving Averages (MA)
Moving Averages are one of the most widely used indicators in Forex trading. They smooth historical price data to show the average price over a specified period.
- Simple Moving Average (SMA): Calculates the average price over a set period, offering a clear view of the trend.
- Exponential Moving Average (EMA): Gives more weight to recent prices, making it more responsive to market changes.
Tip: Use EMA for short-term trading and SMA for long-term trends.
Relative Strength Index (RSI)
The RSI is a momentum indicator that measures the strength and speed of price movements. It ranges from 0 to 100, with levels above 70 indicating overbought conditions and levels below 30 indicating oversold conditions.
- Helps traders spot potential reversals.
- Ideal for identifying entry and exit points during trend reversals.
Bollinger Bands
Bollinger Bands consist of a middle band (usually a Moving Average) and two outer bands that measure volatility.
- When the bands expand, it signals high volatility.
- When the bands contract, it indicates low volatility, often preceding a breakout.
Strategy: Look for price movements near the outer bands to identify overbought or oversold conditions.
MACD (Moving Average Convergence Divergence)
The MACD indicator combines trend and momentum analysis. It consists of:
- The MACD line (difference between two EMAs).
- The signal line (EMA of the MACD line).
- A histogram that shows the distance between the MACD line and the signal line.
Tip: Crossovers between the MACD line and the signal line often signal buy or sell opportunities.
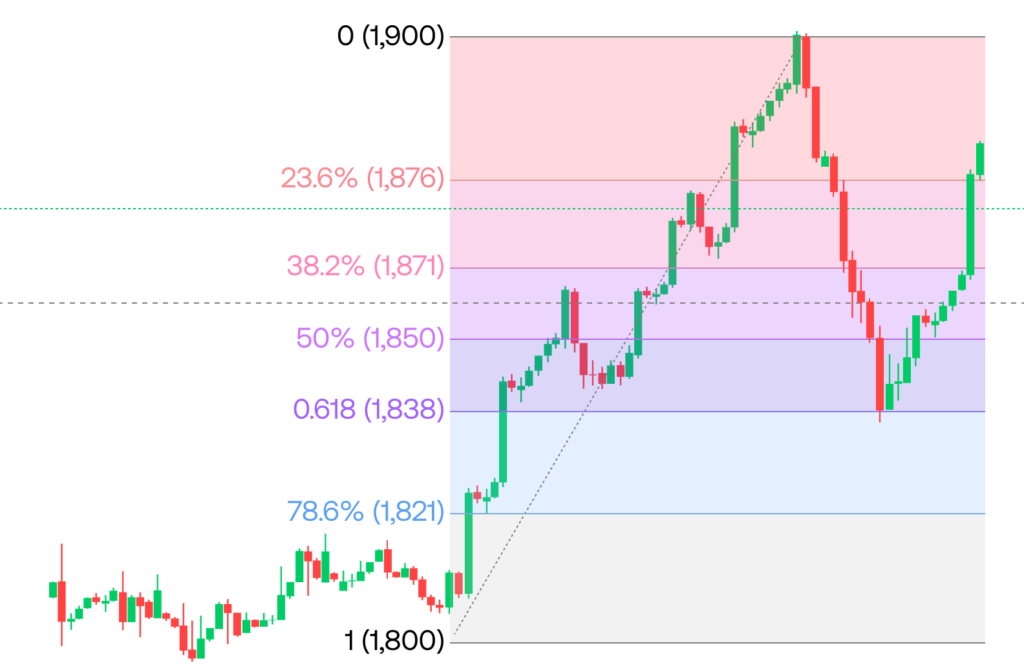
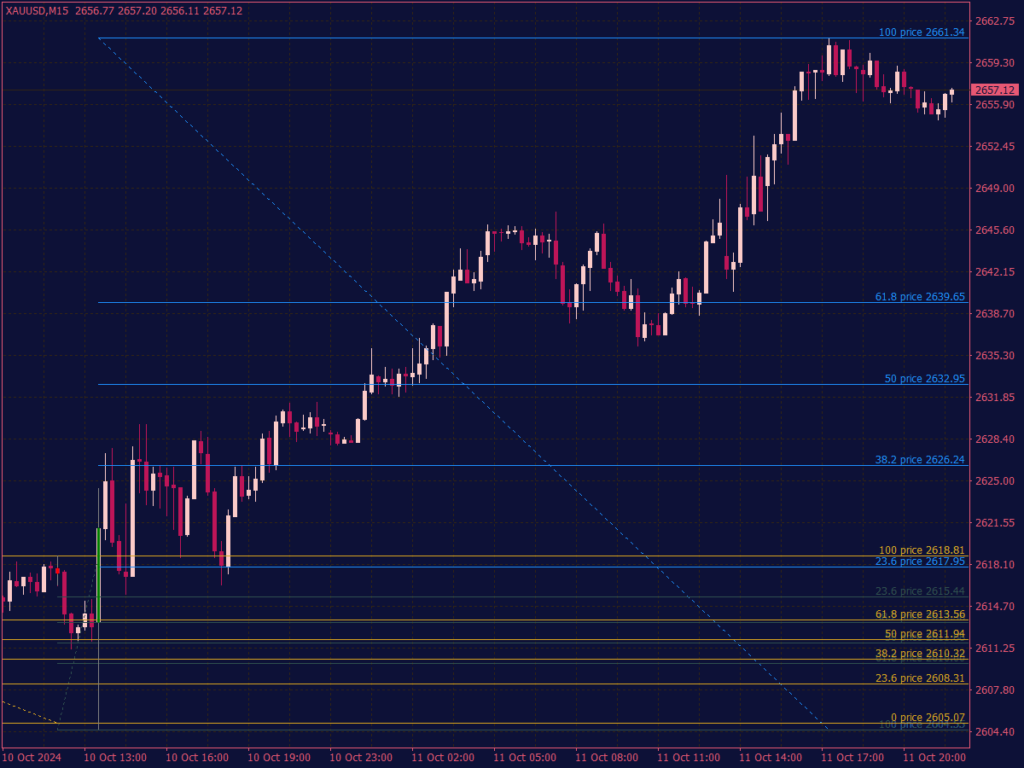
Fibonacci Retracement
This tool is used to identify potential support and resistance levels based on Fibonacci ratios (23.6%, 38.2%, 50%, 61.8%, and 78.6%).
- Helps traders predict where prices may retrace before continuing their trend.
- Ideal for spotting reversal zones during a trending market.
How to Combine Technical Indicators for Better Results
Using a single technical indicator can provide valuable insights, but combining multiple indicators can lead to more accurate predictions and robust trading strategies. This approach, often referred to as indicator confluence, helps traders minimize false signals and identify high-probability trade setups.
Choose Complementary Indicators
To avoid redundancy, select indicators that analyze different aspects of the market, such as trend, momentum, and volatility. For example:
- Combine a trend-following indicator like Moving Averages with a momentum indicator like RSI.
- Use Bollinger Bands (volatility) alongside the MACD (trend and momentum).
This ensures you have a comprehensive view of market conditions.
Confirm Signals
Using multiple indicators helps confirm trading signals. For instance:
- A buy signal may be stronger if the RSI indicates oversold conditions, and the MACD shows a bullish crossover.
- A sell signal might be more reliable if prices break below the lower Bollinger Band while the RSI indicates overbought conditions.
Avoid Overloading Your Chart
While combining indicators can be effective, too many indicators can clutter your chart and lead to analysis paralysis. Stick to 2-3 complementary indicators to maintain clarity.
Backtest Your Strategy
Before applying a combination of indicators in live trading, test your strategy using historical data. Backtesting helps ensure your chosen combination is effective under various market conditions.
Adapt to Market Conditions
Different market environments require different indicator combinations. For example:
- In a trending market, focus on trend-following indicators like Moving Averages and MACD.
- In a range-bound market, prioritize oscillators like RSI and Stochastic Oscillator.
By combining the right technical indicators, you can create a more reliable and profitable trading strategy.
Common Mistakes to Avoid with Technical Indicators
While technical indicators are powerful tools, misusing them can lead to poor trading decisions and losses. Here are common mistakes traders should avoid:
Overreliance on a Single Indicator
Relying solely on one indicator can provide incomplete or misleading information. For instance, using only Moving Averages might miss short-term price reversals, while relying exclusively on RSI may fail to capture long-term trends.
Solution: Combine indicators that provide a well-rounded analysis of market conditions.
Ignoring Market Context
Indicators work best when used in conjunction with an understanding of the overall market context. For example:
- In a highly volatile market, trend-following indicators may generate false signals.
- During a strong trend, oscillators like RSI may remain overbought or oversold for extended periods, leading to premature trades.
Solution: Analyze price action and market conditions before relying on indicator signals.
Using Too Many Indicators
Adding multiple indicators to your chart can lead to conflicting signals and analysis paralysis. For example, combining MACD, RSI, Stochastic Oscillator, and Bollinger Bands might overwhelm rather than clarify your decision-making process.
Solution: Focus on 2-3 complementary indicators to maintain clarity.
Ignoring Backtesting
Many traders skip backtesting their strategies and jump straight into live trading. This can lead to unexpected losses if the chosen indicators don’t perform well in specific market conditions.
Solution: Always backtest your strategy using historical data before implementing it in real-time.
Trading Based on Lagging Indicators Alone
Lagging indicators, like Moving Averages, provide signals after a trend has already formed, which might result in delayed entries or exits.
Solution: Combine lagging indicators with leading ones, such as RSI or Stochastic Oscillator, to enhance timing.
Ignoring Risk Management
Even the best indicator combinations can fail without proper risk management. Many traders ignore stop-loss orders or over-leverage their positions based on overconfidence in their indicators.
Solution: Always use risk management tools, including stop-loss and position sizing, to protect your capital.
By avoiding these common mistakes, traders can use technical indicators effectively to improve their trading outcomes.
How to Choose the Best Indicators for Your Trading Style
Selecting the best technical indicators depends on your unique trading style and goals. Whether you are a day trader, swing trader, or long-term investor, using the right tools can significantly improve your performance. Here’s how to choose indicators that align with your strategy:
Understand Your Trading Style
- Day Traders: Need indicators that provide quick, real-time signals. Examples include Stochastic Oscillator, Moving Averages, and Volume indicators.
- Swing Traders: Prefer indicators that focus on medium-term trends and reversals, like RSI, MACD, and Fibonacci Retracement.
- Position Traders: Rely on indicators that highlight long-term trends, such as Simple Moving Averages (SMA) and Bollinger Bands.
Tip: Choose indicators that fit the timeframe and market dynamics you usually trade in.
Focus on Market Conditions
Different indicators work better in specific market conditions:
- Trending Markets: Use Moving Averages and MACD to capture the trend direction and momentum.
- Range-Bound Markets: Oscillators like RSI and Stochastic Oscillator help identify overbought and oversold levels.
- Volatile Markets: Use Bollinger Bands and Average True Range (ATR) to measure and adapt to volatility.
Prioritize Simplicity
Avoid overloading your chart with too many indicators. Instead, choose 2-3 complementary indicators that provide a balanced view of trend, momentum, and volatility.
Test and Refine Your Choices
Backtest different indicators on historical data to determine their effectiveness for your trading style. Monitor their performance in live markets and refine your choices as needed.
Align with Your Risk Tolerance
Indicators like ATR and Bollinger Bands can help you manage risk by providing insights into market volatility. Use them to set appropriate stop-loss levels and position sizes.
By aligning your choice of technical indicators with your trading style and goals, you can enhance your ability to make informed, data-driven decisions.
Advanced Tips for Using Technical Indicators Effectively
Mastering technical indicators requires more than just knowing how they work. Here are advanced tips to help you use them more effectively:
Combine Indicators for Confluence
Relying on a single indicator can lead to false signals. Combine complementary indicators to confirm trade setups:
- Use RSI to identify overbought or oversold conditions and pair it with Bollinger Bands to spot breakouts.
- Combine MACD for momentum analysis with Fibonacci Retracement for precise entry and exit points.
Optimize Indicator Settings
Default indicator settings may not suit all market conditions or trading styles. Adjust settings based on your timeframe and the currency pairs you trade:
- For shorter timeframes, use smaller periods for indicators like Moving Averages or RSI.
- For longer timeframes, increase the period to capture broader market trends.
Pay Attention to Divergences
Divergences occur when the indicator’s movement deviates from price action, often signaling potential reversals:
- A bullish divergence happens when prices make lower lows while the RSI makes higher lows, indicating a potential upward reversal.
- A bearish divergence occurs when prices make higher highs while the MACD makes lower highs, signaling a potential downward move.
Incorporate Multi-Timeframe Analysis
Use indicators across multiple timeframes for a holistic view of the market:
- Analyze long-term trends on the daily or weekly chart with Moving Averages.
- Spot short-term entry points on the hourly or 15-minute chart using RSI or Stochastic Oscillator.
Use Indicators as a Guide, Not a Rule
Indicators are tools, not guarantees. Always validate indicator signals with price action analysis, chart patterns, and other technical tools.
Combine with Fundamental Analysis
For well-rounded trading decisions, pair technical indicators with fundamental analysis. For instance:
- Use RSI to identify a potential buying opportunity, and confirm it with positive economic data or news.
By applying these advanced tips, you can maximize the effectiveness of technical indicators and gain an edge in Forex trading.
Conclusion
The use of technical indicators in Forex trading plays a pivotal role in enhancing decision-making and boosting profitability. By understanding the functionality of these indicators, combining them effectively, and avoiding common mistakes, traders can develop strategies tailored to their goals. Whether you’re a day trader looking for quick insights or a long-term investor seeking trend analysis, selecting the best technical indicators for Forex trading aligned with your trading style is essential.
Remember, no indicator is infallible. Success in Forex trading comes from combining technical tools, fundamental analysis, and disciplined risk management. Keep learning, experimenting, and refining your strategies to achieve consistent results in the ever-evolving Forex market.
Read more Forex Trading in High Volatility
Frequently Asked Questions
What are the most reliable technical indicators for Forex trading?
The most reliable indicators depend on your trading style and goals. Commonly used indicators include:
- Moving Averages for trend analysis.
- RSI for momentum and overbought/oversold conditions.
- MACD for momentum and trend confirmation.
- Bollinger Bands for volatility measurement.
Can I rely solely on technical indicators for trading decisions?
While technical indicators are powerful tools, relying solely on them can lead to poor decisions. It’s crucial to combine them with price action analysis, fundamental data, and proper risk management for a balanced trading strategy.
How many technical indicators should I use?
Using too many indicators can lead to analysis paralysis. Ideally, focus on 2-3 complementary indicators that provide insights into trend, momentum, and volatility for a clearer trading perspective.
What is the best indicator for beginners in Forex trading?
For beginners, simple indicators like Simple Moving Averages (SMA), Relative Strength Index (RSI), and MACD are easy to understand and highly effective for learning market trends and momentum.