Bollinger Bands in Forex Trading

In the world of Forex trading, technical analysis plays a crucial role in making informed decisions. One of the most popular tools for traders is the Bollinger Bands. Understanding how to use Bollinger Bands in Forex trading can help traders. Identify potential entry and exit points with greater accuracy. In this article, we will dive deep into what Bollinger Bands are, how they work, and how to use them effectively to enhance your trading strategy.
Introduction to Bollinger Bands in Forex Trading
What Are Bollinger Bands?
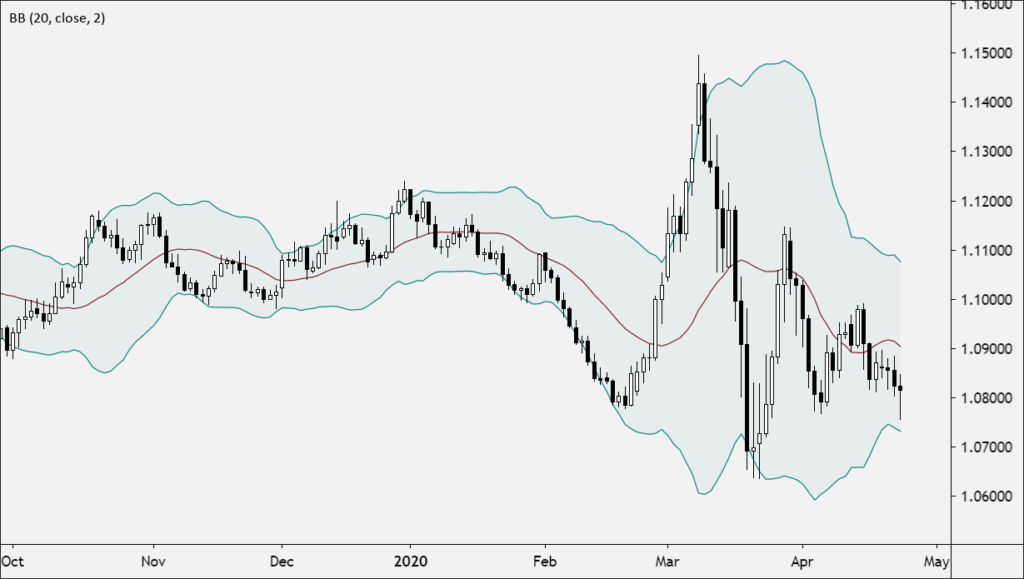
Bollinger Bands are a technical analysis tool developed by John Bollinger in the 1980s. They consist of three bands that move in conjunction with the price action of the currency pair you are trading:
- Middle Band: This is a simple moving average (SMA), typically set to a 20-period moving average. The middle band serves as the baseline and is the reference point for the upper and lower bands.
- Upper Band: The upper band is calculated by adding two times the standard deviation (a measure of volatility) to the middle band. It represents the overbought condition in the market, indicating a potential price reversal or consolidation.
- Lower Band: The lower band is calculated by subtracting two times the standard deviation from the middle band. It marks the oversold level, signaling that the price could bounce back or reverse.
The combination of these three bands creates a price channel that adapts to market volatility. Providing a visual representation of price action and potential price points. Where a reversal or breakout might occur.
History of Bollinger Bands in Forex
John Bollinger introduced the concept of Bollinger Bands in the 1980s as a way to measure volatility and provide a more dynamic view of price behavior. His goal was to create a tool that could help traders identify whether the market was overbought or oversold. And also gauge the market’s volatility. Since their introduction, Bollinger Bands have become one of the most widely used Forex indicators. Appreciated for their ability to adapt to different market conditions.
Bollinger Bands have evolved over time, with traders using variations of the standard settings to suit different time frames or asset types. Their ability to adjust with changing volatility makes them especially useful in Forex. Where price movements can be swift and unpredictable.
The Basics of Bollinger Bands in Forex Trading
Understanding the Bands and Their Calculation
Bollinger Bands are a volatility-based indicator that responds to the price’s volatility over a set period. To calculate the middle band, a simple moving average of the closing prices for a chosen number of periods is taken. Typically, this is a 20-period SMA, though traders may adjust this depending on their strategy.
The upper band is calculated by adding two times the standard deviation of the price to the middle band. Standard deviation is a statistical measure that shows the degree of price variation from the mean. And it expands or contracts based on how much the price fluctuates.
The lower band is calculated by subtracting two times the standard deviation from the middle band. The wider the bands, the higher the market volatility. When volatility decreases, the bands contract, and when volatility increases, the bands expand.
These three components help traders assess the market’s volatility and price extremes, making Bollinger Bands an effective tool for identifying overbought and oversold conditions, as well as potential breakouts or reversals.
How Bollinger Bands Work
Bollinger Bands work by adjusting to the market’s volatility. When the market is experiencing low volatility, the bands will contract, creating a narrow price channel. This signals that the market may be preparing for a breakout. On the other hand, when the market is volatile, the bands will expand, indicating that price movements may be large and uncertain.
- Price Touching the Upper Band: When the price touches or moves outside the upper band, it suggests that the market is becoming overbought, and there may be a reversal or a retracement coming.
- Price Touching the Lower Band: Conversely, when the price touches or moves outside the lower band, it suggests that the market is becoming oversold, and a reversal or price bounce is possible.
Bollinger Bands also allow traders to identify volatility trends. If the bands are consistently expanding, it indicates high volatility in the market, often suggesting that a trend is in motion. If the bands are contracting, it may indicate a period of consolidation before a potential breakout.
Conclusion
In this section, we have explored the fundamentals of Bollinger Bands, including how they are calculated, their historical significance, and how they function in Forex trading. Understanding these basics sets the stage for learning more advanced strategies and techniques to leverage Bollinger Bands for successful Forex trading.
How to Use Bollinger Bands in Forex Trading
Identifying Market Conditions with Bollinger Bands
Bollinger Bands are invaluable for identifying various market conditions, such as trending or range-bound markets. By observing the position of the price relative to the bands. Traders can gain insights into the market’s current behavior.
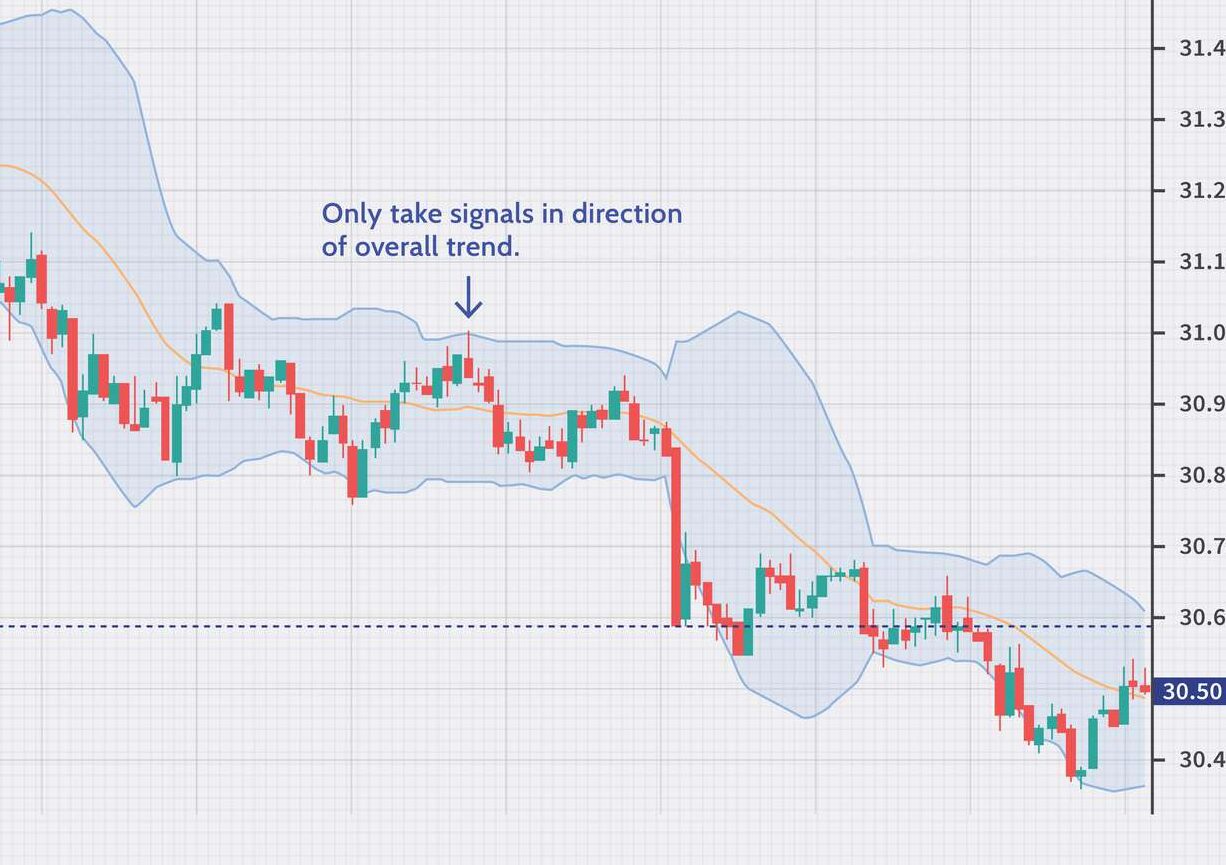
- Trending Markets: In a strong trend, the price tends to move away from the middle band and hover closer to the upper or lower band. When the price consistently touches or stays near the upper band. And when it touches or stays near the lower band, it signals a downtrend. In these markets, traders can look for pullbacks or retracements to enter in the direction of the trend.
- Range-Bound Markets: In a range-bound market, the price oscillates between the upper and lower bands. Here, the bands help traders identify potential overbought or oversold conditions. If the price reaches the upper band, it may signal an overbought condition, suggesting a potential reversal or a short opportunity. Conversely, when the price touches the lower band, it may indicate an oversold condition, signaling a long opportunity.
Entry and Exit Signals with Bollinger Bands
The upper and lower bands serve as key points for entry and exit signals. Here’s how traders use them effectively:
- Breakout Entry: A breakout occurs when the price moves outside the upper or lower band. This is often seen as an indication that the market is entering a phase of high volatility. A breakout above the upper band signals the possibility of a bullish trend continuation. While a breakout below the lower band suggests a bearish trend continuation. Traders can place a stop-loss just inside the band and take profits as the price moves further in the breakout direction.
- Reversal Entry: If the price touches or bounces off the upper or lower band, this can indicate a potential reversal. For instance, if the price touches the upper band and starts to fall back. Traders might interpret this as an overbought condition, signaling a sell opportunity. Similarly, if the price touches the lower band and starts to rise. It could indicate an oversold condition, signaling a buy opportunity.
Using Bollinger Bands with Other Indicators
While Bollinger Bands are powerful on their own, they become even more effective. When used in conjunction with other technical indicators. Combining Bollinger Bands with indicators like the Relative Strength Index (RSI), Moving Average Convergence Divergence (MACD), or Stochastic Oscillators can help provide confirmation for your trades.
- RSI and Bollinger Bands: The RSI helps confirm whether the market is overbought or oversold, while Bollinger Bands can show if the price is touching or breaching the upper or lower bands. If both the RSI and Bollinger Bands suggest an overbought condition, this can be a strong sell signal.
- MACD and Bollinger Bands: The MACD is a trend-following momentum indicator. When combined with Bollinger Bands, a MACD crossover above the upper band or below the lower band can confirm strong momentum in the breakout direction.
Advanced Bollinger Bands Trading Strategies
The Squeeze Strategy
One of the most powerful strategies with Bollinger Bands is the squeeze strategy. Which focuses on the period when the bands contract. This occurs when market volatility is low, and the price consolidates in a narrow range.
- What Is a Squeeze?: A squeeze happens when the upper and lower bands come very close together, indicating a period of low volatility. Traders view this as a sign that the market is preparing for a potential explosive move, either to the upside or downside.
- How to Trade the Squeeze: To use the squeeze strategy, traders wait for the price to breakout of the consolidation range once the bands start expanding again. A breakout above the upper band suggests a bullish move, while a breakout below the lower band signals a bearish move. It’s important to use a stop-loss just inside the range and trade in the direction of the breakout.
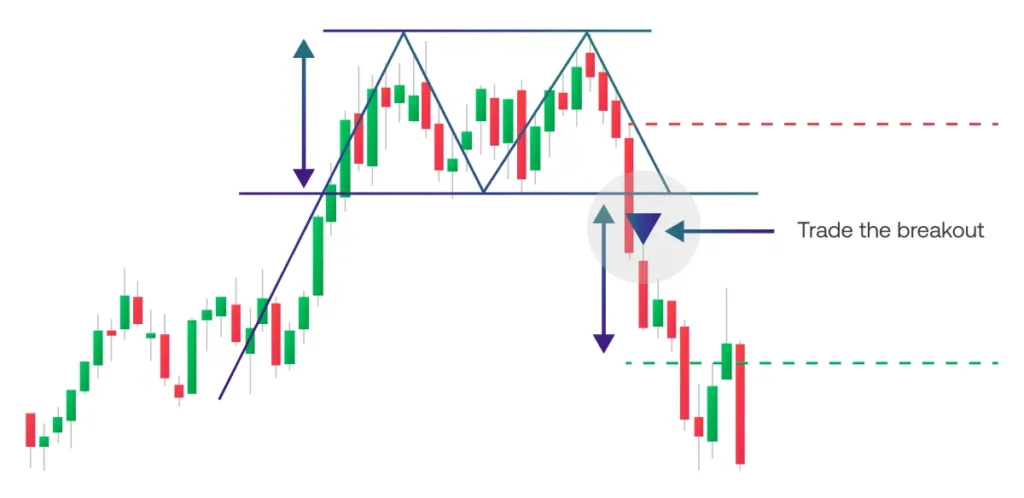
Double Bottoms and Tops with Bollinger Bands
Bollinger Bands can also help identify double bottom and double top patterns, which are common reversal signals.
- Double Bottom: A double bottom occurs when the price touches the lower band twice and fails to move lower, indicating potential support. If the price moves up after touching the lower band for the second time, traders often enter a long trade in anticipation of a bullish reversal.
- Double Top: A double top occurs when the price touches the upper band twice and fails to move higher, indicating potential resistance. If the price starts to decline after touching the upper band for the second time, traders may enter a short trade in anticipation of a bearish reversal.
Traders can combine the Bollinger Bands with other chart patterns and candlestick formations to improve the accuracy of these reversal signals.
Using Bollinger Bands with Trendlines
Another advanced strategy involves combining Bollinger Bands with trendlines. Trendlines can help confirm whether the price is respecting the trend or about to reverse.
- Bullish Breakout: When the price breaks above a downtrend line and also moves outside the upper band, it signals a bullish breakout. This can be a strong entry point for a long trade.
- Bearish Breakdown: If the price breaks below an uptrend line and moves outside the lower band, it signals a bearish breakdown, indicating a potential entry for a short trade.
Conclusion
By mastering how to use Bollinger Bands in Forex trading. You can gain a significant edge in identifying market conditions, entry and exit points, and trading opportunities. Whether you’re a beginner or an experienced trader. Bollinger Bands can become an essential part of your trading toolkit. Combining them with other indicators, patterns, and strategies can enhance your decision-making and increase your chances of success.
Tips for Trading with Bollinger Bands in Forex
Combine Bollinger Bands with Other Indicators
To maximize the effectiveness of Bollinger Bands in Forex trading. Consider using them in combination with other technical indicators. This can help provide confirmation signals and reduce false positives. Some effective combinations include:
- RSI (Relative Strength Index): Use the RSI alongside Bollinger Bands to identify overbought and oversold conditions. If the price is touching the upper band and the RSI is above 70. It suggests an overbought market, signaling a potential reversal. Similarly, if the price is at the lower band and the RSI is below 30, the market may be oversold, suggesting a potential reversal to the upside.
- MACD (Moving Average Convergence Divergence): The MACD can help identify momentum and trend direction. When the MACD crosses above the signal line and the price is moving in the direction of the upper band, it could be a strong buy signal. Conversely, a MACD crossover below the signal line while the price touches the lower band might indicate a selling opportunity.
- Stochastic Oscillator: This momentum indicator can confirm if the price is in an overbought or oversold state, which works well when combined with Bollinger Bands. For example, if the price is at the upper band and the stochastic is above 80, it could signal a potential overbought market. When the price is at the lower band and the stochastic is below 20, it might signal an oversold market.
Adjust the Settings of Bollinger Bands for Volatility
The default settings for Bollinger Bands are a 20-period simple moving average (SMA) with 2 standard deviations. However, these settings may not work well in all market conditions. Adjusting the period and deviation of the bands can help fine-tune them for the specific market you’re trading in:
- Period Adjustment: In volatile markets, a shorter period, such as 10-15 periods, may help capture faster price movements. In less volatile markets, a longer period (such as 30-50 periods) might provide a better representation of the market trend.
- Standard Deviation: If the market is highly volatile, increasing the standard deviation (e.g., 2.5 or 3) can help smooth out the bands and reduce false breakouts. Conversely, in a low-volatility environment, using a smaller standard deviation (e.g., 1.5) can help identify tighter price movements and potential reversals.
By adjusting these settings according to the market conditions, you can increase the accuracy of your Bollinger Bands signals.
Pay Attention to Band Expansion and Contraction
One of the most important aspects of Bollinger Bands is their expansion and contraction:
- Band Expansion: When the bands expand, it indicates increased market volatility, often preceding a strong move in the price. A breakout from the squeeze followed by an expansion of the bands usually indicates a trend continuation. Traders should be prepared for significant price movements after such expansions.
- Band Contraction: When the bands contract, it suggests a period of low volatility, and the market is likely consolidating. This is known as the squeeze. Traders should watch closely for a potential breakout when the bands begin to expand again. Squeeze breakouts can often lead to substantial price moves in either direction.
Use Stop-Loss and Take-Profit Strategically
Risk management is crucial when trading with Bollinger Bands. It’s essential to set stop-loss orders to protect your capital and take-profit orders to lock in profits at strategic levels.
- Stop-Loss: Place a stop-loss just inside the bands to avoid getting stopped out too early in case the price momentarily breaks through the bands. For example, if you’re trading a long position, placing a stop-loss below the lower band can protect you from unexpected market reversals.
- Take-Profit: Set your take-profit orders at key levels, such as the next support or resistance, or use a risk-to-reward ratio strategy to ensure that the potential reward outweighs the risk. You can also consider using Fibonacci levels or other chart patterns to set appropriate profit-taking points.
Avoid Over-Trading
One of the most important tips for trading with Bollinger Bands is to avoid over-trading. Just because the price touches or breaks through the bands does not always signal an immediate trade. Waiting for confirmation from other indicators or chart patterns will help you make more informed and profitable decisions.
- Patience is Key: Wait for the price to either confirm the breakout or provide signs of a reversal before entering a position. By practicing patience and waiting for the right opportunities, you increase your chances of successful trades.
Conclusion
Incorporating Bollinger Bands into your Forex trading strategy can significantly enhance your ability to identify market conditions, entry points, and volatility. By understanding how to use the bands for trend-following, range-bound trading, and breakouts, you can make more informed trading decisions. Additionally, using Bollinger Bands in combination with other technical indicators, adjusting the settings for volatility, and employing sound risk management strategies will help you become a more successful trader.
By practicing patience, learning how to interpret the expansion and contraction of the bands, and avoiding over-trading, you can increase your chances of profitable trades in the dynamic world of Forex.
Read more Top Forex Strategies for Small Accounts
Frequently Asked Questions
What Are Bollinger Bands and How Do They Work in Forex Trading?
Bollinger Bands are a volatility indicator that consists of three lines: a middle band (simple moving average), an upper band, and a lower band. The bands expand and contract based on market volatility. When the price touches the upper band, it may indicate that the market is overbought, while touching the lower band may suggest it is oversold. In Forex, Bollinger Bands help traders identify trend reversals, breakouts, and consolidation periods.
How Do You Trade with Bollinger Bands in Forex?
To trade with Bollinger Bands in Forex, traders use a combination of price action and technical analysis. The primary strategies include:
- Trend-following: Buy when the price bounces off the lower band in an uptrend or sell when it bounces off the upper band in a downtrend.
- Breakout Strategy: Watch for price breakouts when the bands are contracted (known as the “squeeze”). A breakout beyond the bands can signal a strong move in either direction.
- Overbought/Oversold Conditions: Look for price touching the upper band for overbought conditions or the lower band for oversold conditions, signaling possible reversals.
What is the Best Timeframe for Trading with Bollinger Bands in Forex?
The best timeframe for trading with Bollinger Bands in Forex depends on your trading style:
- Scalpers: Use shorter timeframes, like 5-minute or 15-minute charts, to capture small price movements.
- Day Traders: 30-minute to 1-hour charts work well for capturing medium-term moves.
- Swing Traders: 4-hour or daily charts provide better context for longer-term price action and trends.
Always adapt the timeframe to your trading strategy and risk tolerance.
How Can I Improve the Accuracy of Bollinger Bands in Forex?
To improve the accuracy of Bollinger Bands in Forex, consider the following tips:
- Combine with other indicators like RSI, MACD, or Stochastic Oscillator for better confirmation.
- Adjust the settings (periods and standard deviation) based on market conditions. A higher standard deviation can help in volatile markets.
- Look for convergence and divergence between the price action and the bands to spot possible trend reversals.