Forex Trading-Fibonacci Retracement Basics
Fibonacci retracements are a powerful tool in Forex trading, helping traders identify potential price reversals and key support and resistance levels. By using the mathematical ratios derived from the Fibonacci sequence. Traders can predict market trends with greater accuracy. In Forex Trading-Fibonacci Retracement Basics, we’ll explore how to effectively apply Fibonacci retracements to your Forex trading strategy. Offering insights into entry and exit points, risk management, and market analysis. Whether you’re a beginner or an experienced trader, mastering Fibonacci retracements can enhance your trading performance and decision-making process.
Introduction to Fibonacci Retracements in Forex Trading
Fibonacci retracements are one of the most widely used tools in Forex trading. They help traders identify key levels where the market might reverse its trend. The Fibonacci sequence is a series of numbers that appear in nature, art, and even in financial markets. By applying this sequence to price charts, traders can forecast potential turning points in the market.
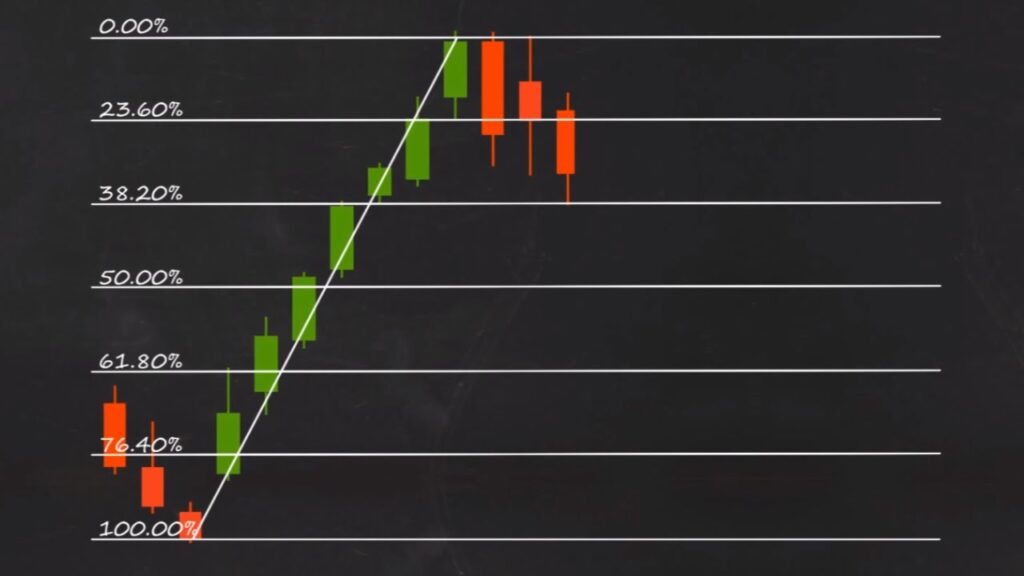
The Fibonacci retracement tool is based on the belief that prices will often retrace a predictable portion of a move, after which they will continue in the original direction. These retracements are measured using the ratios derived from the Fibonacci sequence—23.6%, 38.2%, 50%, 61.8%, and sometimes 76.4%.
Traders in the Forex market use these levels to predict potential areas where price might reverse, helping them enter and exit trades at optimal points. By marking the high and low points of a significant price movement, traders can plot the Fibonacci retracement levels on a chart. These levels often serve as support (price may bounce up) or resistance (price may reverse down) during price retracements.
Understanding the Basics of Fibonacci Retracements in Forex
Fibonacci retracements are grounded in mathematics. But their application in Forex trading is relatively straightforward once you grasp the fundamental concepts. Here’s a simple breakdown of how they work:
The Fibonacci Sequence
The Fibonacci sequence starts with the numbers 0 and 1, and each subsequent number is the sum of the previous two. So, the sequence looks like this: 0, 1, 1, 2, 3, 5, 8, 13, 21, 34, and so on. The key ratios used in Fibonacci retracements come from this sequence, with the most important being:
Fibonacci Retracement Levels in Forex
These percentages represent how much of a previous move the price may retrace before continuing in the same direction. For instance, if the price of a currency pair moves from a low of 1.1000 to a high of 1.1500, the Fibonacci retracement levels are calculated as follows:
- 23.6% retracement level = 1.1000 + (0.1500 × 23.6%) = 1.113638.2% retracement level = 1.1000 + (0.1500 × 38.2%) = 1.114350% retracement level = 1.1000 + (0.1500 × 50%) = 1.125061.8% retracement level = 1.1000 + (0.1500 × 61.8%) = 1.1367
Using Fibonacci Retracements in Forex Trading
To apply Fibonacci retracements in Forex trading, traders first need to identify the most recent swing high and swing low on the chart. These are the key points where the price made a significant move up or down. After marking the high and low, traders can draw the Fibonacci retracement tool on their chart. The retracement levels will then automatically be plotted. These levels are used to predict potential areas of support and resistance. Allowing traders to make more informed decisions on entry and exit points.
How to Use Fibonacci Retracements in Forex Trading
Fibonacci retracements are a powerful tool in Forex trading because they allow traders to identify key price levels where the market may reverse its direction. However, knowing how to use Fibonacci retracements effectively requires understanding the best practices and applying them correctly to your charts.
Step-by-Step Guide to Drawing Fibonacci Retracements
Identify the Trend
Before you can apply Fibonacci retracements, it’s important to first identify the prevailing trend. Is the market in an uptrend or downtrend? Fibonacci retracements are best used during trends, as they help identify potential reversal points during pullbacks. If you’re trading in an uptrend, the retracement will be applied from the low to the high of the move. In a downtrend, the retracement is drawn from the high to the low.
Select the Correct Swing High and Swing Low
Once you’ve identified the trend, the next step is to select the swing high and swing low. A swing high is the highest point in the price move, and the swing low is the lowest point. These are the two reference points for drawing the retracement levels. The retracement tool will calculate the key levels between these two points.
Plot Fibonacci Levels on the Chart
After selecting your swing points, use your trading platform’s Fibonacci retracement tool to draw the levels. For example, if you’re in an uptrend, click on the swing low and drag the tool to the swing high. The tool will automatically display the Fibonacci levels, such as 23.6%, 38.2%, 50%, and 61.8%, on the chart. These levels represent areas where the price may potentially reverse.
Look for Confirmation Signals
While Fibonacci retracement levels are powerful, they are not foolproof. It’s important to confirm the potential reversal using other technical indicators. For example:
- Candlestick patterns: Look for reversal candlestick patterns, such as doji, engulfing patterns, or hammer at Fibonacci levels.
- Volume: Strong volume at a Fibonacci level may confirm the strength of a reversal.
- Momentum indicators: Indicators like RSI (Relative Strength Index) or MACD (Moving Average Convergence Divergence) can help confirm overbought or oversold conditions at key retracement levels.
Place Stop-Loss and Take-Profit Orders
Once you’ve identified a valid entry point based on Fibonacci retracements, it’s crucial to place a stop-loss order to manage risk. A good rule of thumb is to place the stop just below the next Fibonacci level. For example, if you’re buying near the 38.2% retracement level, place your stop just below the 50% level. Similarly, set a take-profit order at the next major support or resistance level.
Advanced Techniques with Fibonacci Retracements in Forex
As you become more experienced with Fibonacci retracements, you can integrate advanced techniques to improve your trading strategy. These techniques can help you gain deeper insights into market structure and enhance the effectiveness of Fibonacci levels.
Combining Fibonacci with Price Action Analysis
One of the most powerful ways to use Fibonacci retracements in Forex is by combining them with price action analysis. Price action involves analyzing candlestick patterns, support and resistance, and the overall structure of the market. By observing how the price reacts at Fibonacci levels, traders can gain valuable insights into potential reversals.
For example, if the price retraces to the 50% Fibonacci level and forms a bullish engulfing candlestick pattern, it could signal a strong buy opportunity. Similarly, if a bearish reversal pattern occurs at the 61.8% Fibonacci retracement, it could indicate a potential trend continuation or sell signal.
Using Fibonacci for Trend Reversals
Fibonacci retracements are not just useful during pullbacks but can also be an excellent tool for spotting trend reversals. When a market reaches a key Fibonacci level, and there is a significant price rejection (i.e., wicks or long candles), it could indicate a potential reversal.
A common strategy for trend reversals is to use Fibonacci extensions alongside retracements. Fibonacci extensions help you predict where the market might move after the price retraces. For example, if the price retraces to the 38.2% level, the 61.8% extension could serve as a potential price target.
Fibonacci Confluence and Its Impact on Trading Strategies
Fibonacci confluence refers to the concept of multiple Fibonacci levels aligning with other technical factors, such as trendlines, support and resistance, or moving averages. The more confluence factors that align, the higher the probability of a successful trade.
For example, if the 23.6% Fibonacci level aligns with a previous support level and a trendline, this area may become a stronger level of support or resistance. When multiple indicators, including Fibonacci levels, come together, traders should pay close attention as it could signal a high-probability entry or exit point.
Fibonacci Extensions vs. Fibonacci Retracements
While Fibonacci retracements are used to find potential reversal points in the market during a trend pullback, Fibonacci extensions are used to predict where the price may go after a pullback or retracement has occurred.
Fibonacci extensions are typically drawn beyond the 100% level, with common extension levels including 161.8%, 261.8%, and 423.6%. Traders use Fibonacci extensions to forecast potential price targets after a significant retracement. By combining retracement and extension levels, traders can predict both potential reversal points and profit-taking zones.
Fibonacci and Multiple Timeframe Analysis
Another advanced technique is to apply Fibonacci retracements across different timeframes. By using a top-down approach, you can confirm the strength of the retracement across multiple timeframes (e.g., daily, 4-hour, and 1-hour). A Fibonacci retracement that aligns across several timeframes is often a stronger level and more likely to result in a reversal or continuation.
For example, if the 61.8% level on a daily chart coincides with the 38.2% level on a 4-hour chart. This would increase the probability of a reversal at that level. Multiple timeframe analysis is an excellent way to validate the strength of Fibonacci levels and improve the accuracy of your trades.
Common Mistakes to Avoid When Using Fibonacci in Forex
Fibonacci retracements are an excellent tool for identifying potential price levels in the Forex market, but using them incorrectly can lead to losses. It’s important to understand and avoid common mistakes to improve your chances of success. Here are some of the most frequent mistakes traders make when using Fibonacci retracements.
Ignoring the Overall Trend
One of the most common mistakes traders make when using Fibonacci retracements is ignoring the overall trend. Fibonacci retracements are most effective when used in alignment with the market’s trend direction. Applying the tool to counter-trend or range-bound markets can lead to misleading results.
For example, if the market is in a strong uptrend, using Fibonacci retracements on a downward price move might suggest a reversal that doesn’t occur. Always make sure the retracement aligns with the trend direction— use Fibonacci in uptrends to find potential support levels and in downtrends to find resistance levels.
Misplacing Swing Points
Accurately identifying the correct swing high and swing low is crucial when drawing Fibonacci retracement levels. Misplacing these points can lead to inaccurate retracement levels, resulting in poor trade decisions.
For instance, a trader might accidentally use a minor peak or trough as the reference point instead of a significant swing point. This leads to false retracement levels that do not accurately reflect the market’s structure. Always ensure you’re using the major swing high and swing low for more reliable Fibonacci retracements.
Over-relying on Fibonacci Retracements Alone
While Fibonacci retracements can provide useful price levels, relying solely on them can be a risky mistake. Fibonacci retracement levels are just one tool in a trader’s arsenal. They should be combined with other technical indicators and price action patterns for confirmation. For example, using Fibonacci retracements alongside candlestick patterns, volume, or momentum indicators like RSI (Relative Strength Index) can offer more robust trade signals.
A common mistake is assuming that Fibonacci levels alone will predict the market’s direction. Price action and support and resistance zones also play crucial roles in determining whether a retracement will hold or break.
Failing to Set Proper Stop-Loss and Take-Profit Levels
Many traders overlook the importance of risk management when using Fibonacci retracements. After identifying potential entry points, it’s crucial to place stop-loss orders to protect your capital. Without a proper stop-loss strategy, a retracement could turn into a false breakout, resulting in significant losses.
Additionally, take-profit levels should be placed at reasonable Fibonacci extension levels or other technical levels, such as previous support/resistance. Failure to define these exit points can result in missed profit-taking opportunities or extended losses.
Expecting Perfect Reversals at Fibonacci Levels
Fibonacci retracements often provide strong support or resistance levels, but they are not always perfect. Markets are unpredictable, and false signals can occur. Expecting that the market will always reverse at the 38.2%, 50%, or 61.8% retracement levels can be unrealistic.
The key is to treat Fibonacci levels as potential areas of interest rather than guaranteed turning points. Confirmation signals, such as candlestick patterns or other indicators, should be used to validate whether the market is truly reversing.
Real-Life Examples of Fibonacci Retracements in Forex Trading
Understanding how Fibonacci retracements work in real-life scenarios is essential to mastering their use in Forex trading. Here, we’ll explore two examples of how Fibonacci retracements can be applied in real Forex market conditions.
EUR/USD – Using Fibonacci to Identify a Reversal
Let’s consider a scenario with the EUR/USD currency pair. The market is in a strong uptrend, and a trader identifies a significant swing low at 1.1000 and a swing high at 1.1500. The trader then applies the Fibonacci retracement tool to these two points.
- The 38.2% level is at 1.1300, the 50% level is at 1.1250, and the 61.8% level is at 1.1200.
- The market pulls back from its high at 1.1500 and starts to retrace. As the price approaches the 50% Fibonacci retracement at 1.1250, a bullish engulfing candle forms on the 1-hour chart.
- The trader sees this as a confirmation and enters a long trade at 1.1250.
- The trade moves in the desired direction, and the trader sets a take-profit order near the next resistance level at 1.1450, which is near the 61.8% Fibonacci extension level.
This example illustrates how the 50% retracement level served as a potential support area where the price reversed and continued its uptrend. The trader used Fibonacci retracements in combination with price action (the bullish engulfing candle) to identify a high-probability entry point.
GBP/JPY – Using Fibonacci to Spot a Trend Continuation
In this example, the GBP/JPY pair is in a strong downtrend, and a trader spots a major swing high at 150.00 and a swing low at 140.00. The Fibonacci retracement tool is applied to these points, which gives the following retracement levels:
- 23.6% retracement at 142.36,
- 38.2% retracement at 143.64,
- 50% retracement at 145.00.
After the price retraces to the 38.2% Fibonacci level at 143.64, the trader observes a bearish engulfing pattern and a drop in volume. These confirmation signals suggest the market is ready to continue the downtrend.
The trader enters a short position at 143.60, placing the stop-loss just above the 50% retracement level at 145.10. The market resumes its downward movement, and the trader exits the position at the next support level at 141.00, which aligns with the 161.8% Fibonacci extension.
This example demonstrates how Fibonacci retracements can also identify trend continuation opportunities. The key is to combine Fibonacci levels with price action signals to confirm the trade setup.
Risk Management and Trading Psychology with Fibonacci
When using Fibonacci retracements in Forex trading, understanding the importance of risk management and trading psychology is crucial for long-term success. Although Fibonacci levels are powerful tools for identifying potential market reversals or continuations, the effectiveness of these tools is diminished without a solid risk management strategy and the right mindset.
Risk Management with Fibonacci Retracements
Effective risk management is a cornerstone of successful trading. Even with the best analysis and tools, losses are inevitable in the Forex market. Properly managing risk can help minimize the impact of these losses and protect your trading capital.
- Position Sizing: When using Fibonacci retracements, it’s important to size your positions appropriately. For example, if you identify a 50% retracement as a potential entry point, consider how much of your capital you are willing to risk based on your stop-loss level.
- Stop-Loss Placement: One of the key elements of risk management with Fibonacci retracements is placing a stop-loss order just beyond significant Fibonacci levels (e.g., the 61.8% retracement level) to protect against false breakouts. If the market moves against your trade, the stop-loss will limit your losses.
- Risk-to-Reward Ratio: The risk-to-reward ratio is essential when planning your trades. After identifying potential entry points with Fibonacci retracements, always calculate the risk (distance from entry to stop-loss) and the reward (distance from entry to target). A common risk-to-reward ratio to aim for is 1:2, meaning you are willing to risk 1 unit of currency for the potential to gain 2 units.
By incorporating a risk management plan, you ensure that any potential losses are controlled and that you don’t expose yourself to large drawdowns, which can affect your overall trading performance.
Trading Psychology and Fibonacci Retracements
The psychological aspect of trading can often be the hardest to master. Traders are prone to making emotional decisions, especially when trading tools like Fibonacci retracements suggest an entry or exit point. Keeping a clear, disciplined mindset is critical.
- Patience: Fibonacci retracements don’t always produce immediate results. Sometimes, price will take time to reach the key Fibonacci levels, or it may not reach the ideal entry point at all. Traders must exercise patience and wait for confirmation before entering a trade. Entering a trade prematurely can lead to false signals and potential losses.
- Avoiding Overtrading: Traders often feel the urge to overtrade when they see multiple potential Fibonacci setups. This is a psychological trap that leads to emotional decision-making and poor outcomes. Stick to your strategy and only take trades that meet your criteria.
- Emotional Control: When trades don’t go according to plan, it’s easy to become frustrated or anxious. Managing your emotions is vital to maintaining consistency and profitability. Developing mental resilience and learning from past mistakes will enhance your overall trading psychology.
Focusing on the long-term process rather than short-term wins and losses can help you stay grounded. Use Fibonacci retracements as a tool, but do not let them cloud your judgment when the market behaves unexpectedly.
Conclusion
In conclusion, Fibonacci retracements offer a highly effective method for analyzing price movements and making informed decisions in Forex trading. However, the key to using Fibonacci retracements successfully lies in combining them with solid risk management practices and sound trading psychology.
To recap:
- Fibonacci retracements provide crucial support and resistance levels, but their power lies in proper position sizing, stop-loss placement, and maintaining a favorable risk-to-reward ratio.
- Managing your emotions, avoiding overtrading, and exercising patience are critical aspects of trading psychology that can lead to long-term success.
- By following a well-defined trading strategy that incorporates Fibonacci retracements alongside technical analysis and risk management, you can increase the probability of successful trades and minimize the impact of losses.
Remember, while Fibonacci retracements are a powerful tool in Forex trading, they should not be used in isolation. A comprehensive approach that combines multiple indicators, a solid risk management plan, and emotional control is the key to successful trading.
Read more Swing Trading vs. Day Trading in Forex
Frequently Asked Questions
What are Fibonacci retracements in Forex trading?
Fibonacci retracements are a popular technical analysis tool used to identify potential levels of support and resistance in the Forex market. These levels are derived from the Fibonacci sequence and are applied to a price movement to predict where the price might reverse or experience a temporary pullback. The key levels are typically 23.6%, 38.2%, 50%, 61.8%, and 100%.
How do I use Fibonacci retracements in Forex trading?
To use Fibonacci retracements, you draw the retracement levels by selecting a significant price swing (either from a low to high or high to low). The retracement levels then act as potential areas where the price might pull back before continuing in the direction of the original trend. Traders typically look for entry points near these levels, using price action or other indicators to confirm their trade.
Can Fibonacci retracements guarantee success in Forex trading?
No, Fibonacci retracements do not guarantee success. Like any other technical analysis tool, they provide potential areas of interest but cannot predict the future with certainty. Traders should use Fibonacci retracements alongside other indicators, a solid risk management strategy, and sound trading psychology to increase the likelihood of success in Forex trading.
What is the most reliable Fibonacci level in Forex trading?
The 61.8% Fibonacci retracement level is often considered the most significant and reliable level in Forex trading. This level is derived from the golden ratio, and many traders believe it represents a strong potential reversal point. However, the other key levels, such as 38.2% and 50%, are also widely used and can provide valuable insights.