Understanding Forex Candlestick Patterns
In the world of Forex trading, understanding candlestick patterns is crucial for analyzing price movements and making informed trading decisions. Forex candlestick patterns offer traders a visual representation of price data, helping them predict future market behavior. These patterns can signal market trends, reversals, and continuation, giving traders insight into market sentiment and psychology. Whether you’re a novice or an experienced trader, mastering candlestick patterns is a powerful tool for improving your trading strategies. In Understanding Forex Candlestick Patterns, we will explore Forex candlestick patterns, breaking down their components and how to interpret them effectively.
What Are Forex Candlestick Patterns?
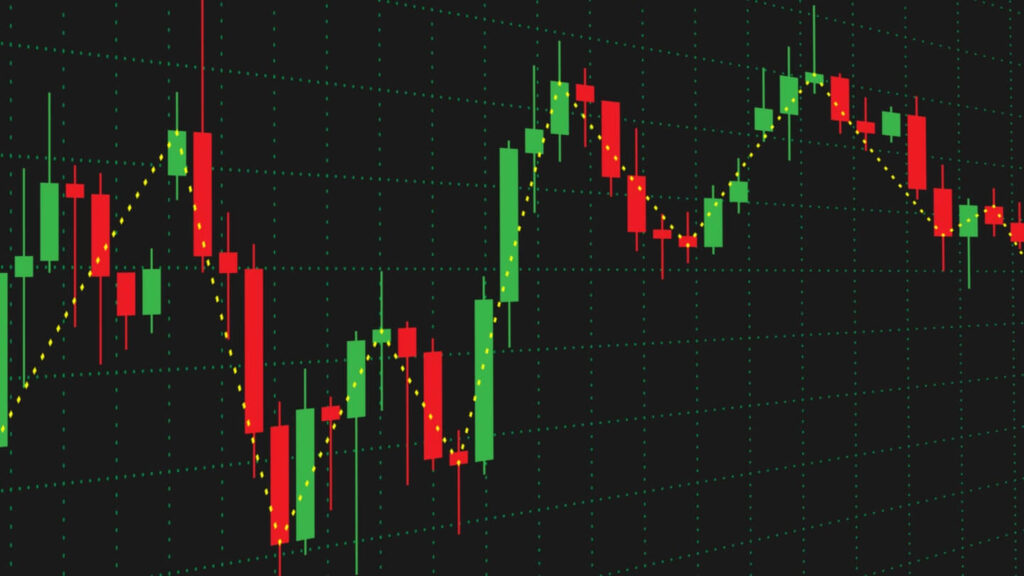
Forex candlestick patterns are visual formations on a chart that show the price movement of a currency pair over a specific period. Each candlestick represents a single unit of time (such as 1 minute, 5 minutes, 1 hour, or daily), and it displays the open, close, high, and low prices for that time interval. By analyzing these patterns, traders can make predictions about the future direction of the market.
In Forex trading, candlestick patterns are essential for identifying potential trend reversals and continuations. These patterns give traders clues about the underlying market sentiment. For example, a bullish candlestick pattern suggests that the price might rise, while a bearish candlestick pattern indicates that the price might fall.
Some of the most common candlestick patterns include the bullish engulfing, doji, hammer, and evening star. By learning to recognize these patterns and understand their significance, traders can develop a more effective trading strategy.
Key Components of a Candlestick
To fully understand Forex candlestick patterns, it’s essential to break down the key components of a single candlestick. Each candlestick has three primary parts: the body, the wick (shadow), and the open and close prices.
Body
The body of the candlestick represents the difference between the open and close prices for a given time period. If the close price is higher than the open price, the candlestick is typically filled with a light or hollow color (often white or green), indicating a bullish trend. Conversely, if the close price is lower than the open price, the candlestick is filled with a darker color (usually red or black), signifying a bearish trend.
The size of the body gives traders valuable insight into the strength of a price move. A long body indicates a strong price movement, while a short body suggests indecision or a small price change.
Wick (Shadow)
The wick or shadow of a candlestick represents the range between the high and low prices during the time period. It shows the extremes to which the price reached during the session. There are two types of wicks:
- Upper Wick (Upper Shadow): This shows the highest price point reached during the period.
- Lower Wick (Lower Shadow): This indicates the lowest price point reached during the period.
A long upper wick and a short lower wick can signal that the market has experienced a reversal, where buyers pushed prices up, but sellers eventually took control and pushed prices back down. Similarly, a long lower wick suggests that sellers pushed prices down, but buyers stepped in to drive the price back up, possibly indicating a potential bullish reversal.
Open and Close Price
The open price is the first price recorded for the given time period, and the close price is the last price. The relationship between the open and close prices is crucial in determining the direction of the market. When the close is above the open, the market is bullish, indicating that buying pressure is dominant. Conversely, when the open is above the close, the market is bearish, indicating that selling pressure is stronger.
Types of Forex Candlestick Patterns
Understanding the different Forex candlestick patterns is essential for traders looking to make informed decisions. These patterns can provide insights into market sentiment, possible trend reversals, and continuations. Here, we’ll discuss some of the most important and commonly recognized Forex candlestick patterns that traders should watch for.
Bullish Patterns
Bullish patterns indicate that the price is likely to rise or is currently rising. These patterns are typically formed when buyers are in control, showing a strong upward momentum. Some of the most popular bullish candlestick patterns include:
- Bullish Engulfing: This occurs when a large, bullish candlestick fully engulfs a smaller bearish candlestick, signaling a potential reversal to the upside. It suggests that the buyers have taken control after a period of selling pressure.
- Morning Star: A three-candlestick pattern, the morning star consists of a bearish candlestick, followed by a small-bodied candle (typically a doji), and then a bullish candlestick. This pattern indicates a strong bullish reversal after a downtrend.
- Hammer: A hammer pattern is characterized by a small body at the top of the candlestick, with a long lower wick. It suggests that selling pressure has been absorbed, and the buyers may take control in the next period. It often signals a potential bullish reversal at the bottom of a downtrend.
Bearish Patterns
Bearish patterns indicate that the price is likely to fall or is currently falling. These patterns occur when sellers dominate the market. Some of the most common bearish candlestick patterns include:
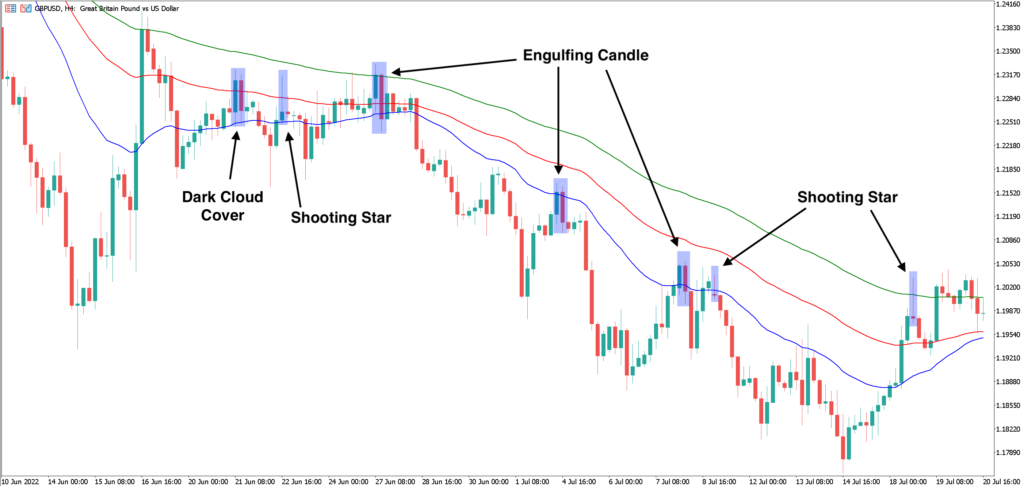
- Bearish Engulfing: The bearish engulfing pattern occurs when a large bearish candlestick engulfs a smaller bullish candlestick. This pattern signals a potential downward movement, where sellers have overtaken the buyers.
- Evening Star: The evening star is the opposite of the morning star. It consists of a large bullish candlestick, followed by a small-bodied candle, and then a large bearish candlestick. This pattern suggests that after an uptrend, the market may reverse downward.
- Shooting Star: The shooting star is a single candlestick pattern with a small body and a long upper wick. It signals a potential bearish reversal at the top of an uptrend, showing that the market may be starting to lose momentum.
Reversal Patterns
Reversal patterns signal a change in the direction of the market. They often appear after a strong trend, either bullish or bearish, and suggest that the trend might reverse. Common reversal candlestick patterns include:
- Doji: A doji occurs when the open and close prices are very close to each other, resulting in a small body with long wicks. It signals indecision in the market, where neither buyers nor sellers dominate. A doji at the top of a bullish trend or the bottom of a bearish trend could indicate a potential reversal.
- Engulfing Patterns: As mentioned above, both bullish engulfing and bearish engulfing are reversal patterns that suggest a change in trend direction.
Continuation Patterns
Continuations patterns indicate that the existing trend (either bullish or bearish) is likely to continue. Traders often use these patterns to enter a position in the direction of the current trend. Some popular continuation patterns include:
- Rising Three Methods: This is a bullish continuation pattern that consists of a long bullish candlestick, followed by several small bearish candlesticks, and then another long bullish candlestick. It indicates that the market is consolidating before continuing its upward movement.
- Falling Three Methods: The falling three methods pattern is the bearish counterpart of the rising three methods. It consists of a long bearish candlestick, followed by small bullish candlesticks, and then another long bearish candlestick. This pattern indicates that the downtrend is likely to continue.
How to Interpret Candlestick Patterns in Forex Trading
Interpreting Forex candlestick patterns effectively is key to making informed trading decisions. Candlestick patterns provide insights into market sentiment and the potential direction of price movements. Here are a few ways to interpret candlestick patterns in Forex trading:
Using Candlestick Patterns for Market Analysis
Candlestick patterns can give you an idea of the current market sentiment. For example:
- Bullish patterns, such as the bullish engulfing and morning star, signal that buyers are in control, and the price may rise.
- Bearish patterns, such as the bearish engulfing and shooting star, suggest that sellers are dominating the market, and a price drop is likely.
By interpreting the strength and significance of these patterns, traders can assess whether the market is in a bullish, bearish, or neutral phase.
Combining Candlestick Patterns with Other Indicators
While candlestick patterns provide valuable insights, they are even more effective when combined with other technical indicators. For example, combining candlestick patterns with moving averages, RSI (Relative Strength Index), or MACD (Moving Average Convergence Divergence) can help confirm the validity of a pattern.
For instance, if a bullish engulfing pattern appears alongside a strong upward trend in the moving average, it could strengthen the belief that the market is likely to continue rising.
Recognizing Market Sentiment Through Candlesticks
Candlestick patterns are often referred to as “market psychology,” as they reflect the emotions and behaviors of traders in the market. For example, a doji indicates uncertainty or indecision, where neither the buyers nor sellers have full control. A long bullish candlestick, on the other hand, indicates that buying pressure is strong.
By recognizing these psychological cues, traders can better understand the market’s potential movements and make more accurate predictions about future price action.
Popular Forex Candlestick Patterns Every Trader Should Know
When it comes to Forex trading, understanding popular candlestick patterns is key to improving your ability to predict market movements. These patterns provide valuable insight into the market sentiment, allowing traders to anticipate potential trend reversals or continuations. Here are some of the most widely recognized and effective Forex candlestick patterns that every trader should be aware of.
Bullish Engulfing
The bullish engulfing pattern is one of the most powerful reversal signals. It occurs when a small bearish candlestick is completely engulfed by a larger bullish candlestick, indicating that buyers have taken control after a period of selling. This pattern typically suggests a potential upward price movement following a downtrend. It is most effective when it appears at key support levels.
Bearish Engulfing
In contrast to the bullish engulfing pattern, the bearish engulfing pattern signals a potential price drop. This pattern occurs when a small bullish candlestick is engulfed by a larger bearish candlestick, indicating that sellers have overwhelmed the buyers. It is often seen at the end of an uptrend and can signal the start of a downtrend. Traders look for this pattern near resistance levels for the most accurate predictions.
Hammer
The hammer pattern is a bullish reversal pattern that usually appears at the bottom of a downtrend. It has a small body with a long lower wick and a short or non-existent upper wick. The long lower wick shows that sellers initially pushed the price down, but the buyers regained control and pushed the price back up, signaling that the market may reverse to the upside. The hammer pattern is considered more reliable when accompanied by higher trading volume.
Shooting Star
The shooting star pattern is the opposite of the hammer and is a bearish reversal pattern that often forms at the top of an uptrend. The shooting star has a small body, a long upper wick, and a small lower wick. It indicates that buyers initially pushed prices higher, but sellers took over, driving the price back down. This suggests that a trend reversal may be imminent, with a potential downward price movement.
Doji
The doji is one of the most important candlestick patterns to watch for in Forex trading. It occurs when the open and close prices are very close to each other, resulting in a candlestick with a small body and long wicks. The doji indicates market indecision, where neither the buyers nor sellers have gained control. When it appears after a strong uptrend or downtrend, it can signal a potential reversal.
Morning Star
The morning star is a bullish reversal pattern that typically appears after a downtrend. It consists of three candlesticks: a large bearish candlestick, followed by a small-bodied candle (often a doji), and finally a bullish candlestick. This pattern indicates that selling pressure is starting to weaken, and buying pressure is increasing, suggesting a potential upward reversal in price.
Evening Star
The evening star is the opposite of the morning star and is a bearish reversal pattern. It consists of three candlesticks: a large bullish candlestick, followed by a small-bodied candle (often a doji), and then a large bearish candlestick. This pattern suggests that the uptrend may be losing strength and that a downward reversal could be on the horizon.
Advantages of Using Candlestick Patterns in Forex Trading
Candlestick patterns offer several advantages for traders seeking to enhance their trading strategies. These patterns provide visual cues that reflect market sentiment and can be used to identify profitable trade opportunities. Below are some of the key advantages of using candlestick patterns in Forex trading.
Clear Visual Representation of Market Sentiment
One of the biggest advantages of candlestick patterns is their ability to visually represent market sentiment. Each candlestick encapsulates the balance of buying and selling pressure during a specific time period. By analyzing these patterns, traders can gain a clearer understanding of whether bulls or bears are in control of the market, allowing them to make more informed decisions.
Easy to Identify
Candlestick patterns are relatively easy to identify, making them accessible for both beginner and experienced traders. Unlike complex technical indicators, which often require advanced knowledge, candlestick patterns can be quickly spotted and interpreted. This simplicity allows traders to focus on reading the market rather than analyzing complicated chart setups.
Useful for Trend Reversal and Continuation Signals
Candlestick patterns are effective at signaling both trend reversals and continuations. For instance, a bullish engulfing pattern after a downtrend signals a potential upward reversal, while a morning star pattern provides confirmation of a shift in momentum. Conversely, patterns like the shooting star and evening star indicate a possible trend reversal in the opposite direction. These signals are invaluable for traders looking to time their entries and exits.
Provides Strong Risk Management Opportunities
Candlestick patterns also assist in effective risk management. For example, if a trader spots a bearish engulfing pattern at a resistance level, they might consider entering a short position, with a tight stop loss just above the resistance. By identifying clear entry points and potential stop levels, traders can use candlestick patterns to control their risk and protect their capital.
Compatible with Other Technical Indicators
Candlestick patterns work well in conjunction with other technical analysis tools, such as moving averages, RSI (Relative Strength Index), and MACD (Moving Average Convergence Divergence). When combined with these indicators, candlestick patterns can provide even more reliable signals, increasing the likelihood of successful trades. For example, a bullish engulfing pattern that occurs above a 50-period moving average could provide additional confirmation for a buy signal.
Offers Insight into Market Psychology
Since candlestick patterns reflect the emotions and actions of market participants, they provide insight into market psychology. For instance, the formation of a doji pattern indicates indecision, while a hammer pattern shows that buyers are attempting to regain control. By understanding these psychological cues, traders can better anticipate potential market moves and adapt their strategies accordingly.
Common Mistakes to Avoid When Trading Candlestick Patterns
While candlestick patterns can be powerful tools for traders, there are several common mistakes that can lead to losses if not properly addressed. Understanding and avoiding these pitfalls can help traders increase their success rate and minimize risks. Below are some of the most frequent mistakes to watch out for when using candlestick patterns in Forex trading.
Ignoring the Bigger Trend
One of the biggest mistakes that traders make is ignoring the overall market trend when trading candlestick patterns. Candlestick patterns are more reliable when they align with the prevailing trend. For example, a bullish engulfing pattern is more effective when it appears after a downtrend, signaling a potential reversal. If you trade a bullish pattern in the middle of an existing uptrend, you could be setting yourself up for failure. Always ensure that your candlestick pattern signals fit within the larger trend context.
Overlooking the Importance of Confirmation
Another common mistake is entering a trade based solely on a candlestick pattern without waiting for confirmation. Candlestick patterns should not be treated in isolation. Traders should wait for additional confirmation signals, such as a follow-up candlestick or a breakout from key support or resistance levels, before executing a trade. For example, after spotting a bullish engulfing pattern, waiting for the next candlestick to close above the previous high can provide confirmation of a true reversal.
Relying on Candlestick Patterns Without Using Stop-Loss Orders
Trading without proper risk management is a recipe for disaster. Even if a candlestick pattern appears promising, it doesn’t guarantee that the market will move in your favor. Stop-loss orders are essential for protecting your capital. Placing a stop loss just below the low of a hammer pattern or above the high of a shooting star pattern can help limit losses in case the market doesn’t behave as expected. Neglecting to set a stop-loss is one of the most dangerous mistakes a trader can make.
Misinterpreting the Doji Pattern
The doji is one of the most commonly misinterpreted candlestick patterns. A doji represents indecision in the market, but it does not necessarily signal an immediate reversal. Some traders might mistakenly take a doji as a signal to enter a trade without considering the context or additional factors. It’s crucial to assess the doji in relation to its previous price action and other indicators. A doji at a key support or resistance level is more significant than one formed in the middle of a trend.
Trading Too Many Patterns at Once
Many traders fall into the trap of trying to trade multiple candlestick patterns simultaneously. While patterns like the bullish engulfing and morning star can be effective, trading too many signals at once can lead to confusion and poor decision-making. It is essential to focus on one or two key patterns that you are comfortable with and that fit your trading style. This helps maintain clarity and reduces the chances of overtrading.
Not Considering Market Conditions
Finally, not taking into account market conditions is a significant mistake when using candlestick patterns. Candlestick patterns tend to be more reliable in trending markets, but in choppy or sideways markets, they may produce false signals. Before trading based on a candlestick pattern, ensure that the market is in a favorable condition. Trend-following strategies work best when the market is moving consistently in one direction, while range-bound strategies are more effective in choppy markets.
Conclusion
In conclusion, understanding Forex candlestick patterns is essential for successful trading, as they offer valuable insights into market sentiment and potential price movements. By recognizing and interpreting common patterns like the bullish engulfing, doji, hammer, and morning star, traders can make more informed decisions and improve their chances of profitable trades.
However, it is important to avoid the common mistakes mentioned, such as ignoring the overall market trend, failing to wait for confirmation, and neglecting risk management. Combining candlestick pattern analysis with other technical indicators and market conditions will provide even more robust trading signals.
Incorporating candlestick patterns into your Forex trading strategy can significantly enhance your trading outcomes, but always remember to use proper risk management techniques and to continually refine your skills for better performance in the market.
Read more Trading Forex During Non-Farm Payroll News
frequently asked question
What are candlestick patterns in Forex trading?
Candlestick patterns are visual representations of price movement on a chart, used by traders to analyze market sentiment and predict future price movements. They provide information about the opening, closing, high, and low prices of an asset during a specific time frame.
Why are candlestick patterns important in Forex trading?
Candlestick patterns are essential because they help traders identify potential reversals, continuations, or indecision in the market. These insights allow traders to make more informed decisions and improve their trading strategies.
What are the most popular candlestick patterns in Forex trading?
Some of the most widely used candlestick patterns include:
- Bullish engulfing
- Bearish engulfing
- Doji
- Hammer
- Shooting star
- Morning star and evening star
How do I interpret a doji candlestick?
A doji candlestick indicates indecision in the market, where the opening and closing prices are nearly the same. Depending on its position in the trend, it can signal a potential reversal or continuation. Additional confirmation is often needed before acting.